
Breaking Down Amazon’s Brand Store Insights
Brand Stores are a unique feature on the Amazon site, serving as dedicated storefronts for brands. Using the Brand Store, consumers can immerse themselves in both product and brand discovery. This helps improve the shopping experience for customers, mirroring what they’re used to seeing on each brand’s dotcom site.
But beyond the consumer-facing side, Amazon Brand Stores also provide a wealth of consumer data that can inform your internal strategy. With recent engagement updates by Amazon that showcase average consumer Dwell Times (time spent on a page) and Bounce Rate (the rate at which consumers left your store reading one page), the Brand Store continues to be a great tool for brands large and small.
Amazon Brand Store Insights Tabs
Before you dive back into Amazon Ads to explore how your brand can utilize these new features, let’s take a moment to review the tabs to make sure you are getting all the data you need for continued success.
Overview Tab
For high-level review, the Overview Tab enables you to see KPIs over the last 30 days from Visitor, Sales, and Store Engagement metrics. You can use this to get an idea about the current state of your digital shelf, before exploring the details.
Traffic Tab
There are 4 dashboards related to consumer traffic:
- Daily visitors: This chart highlights the number of visitors that visit your store page per day. The graph visualizes the data to show if your advertising strategy is effectively building brand consideration.
- Page views: Similar to daily visitors, page views show the number of hits your Brand Store pages receive per day. Rather than just 1 view per person, it includes multiple views by the same audience, showing an average number of page views per visitor. This helps you gauge how often shoppers are viewing your Store and browsing your brand’s products.
- Top sources by views: A bar chart that showcases how consumers arrive at your storefront. This shows where shoppers are coming from before they reach you, helping you to develop your strategy to attract more clicks and generate more visitors and views.
- Top pages by views: This bar chart shows you which pages on your store are the most popular. This can help inform which of your product lines or categories are getting the most interest from groups of shoppers.
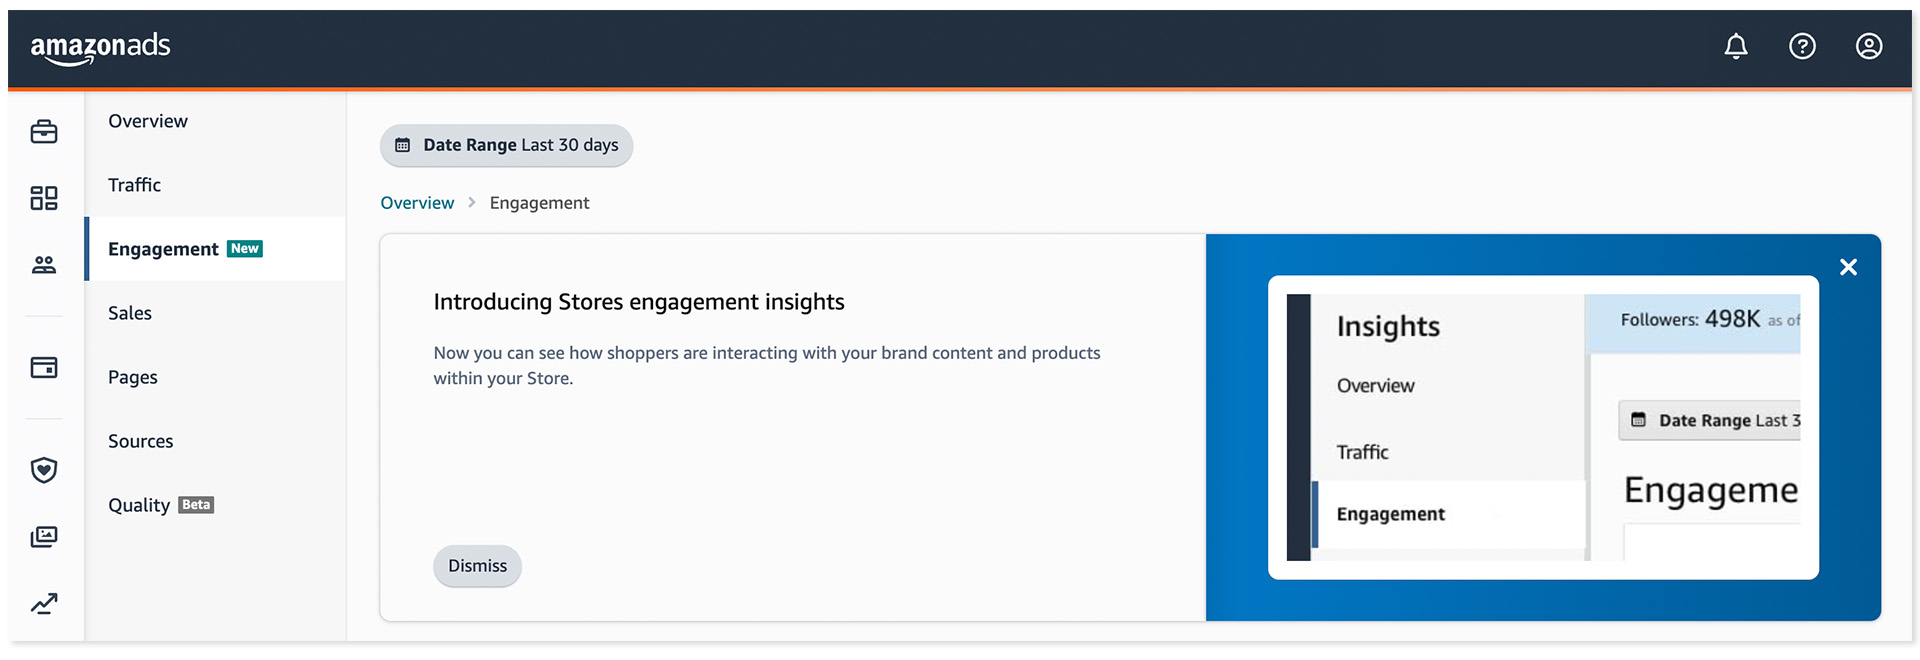
Engagement Tab
The new Engagement tab helps you understand how consumers are interacting with the ASINs in your Brand Store. These metrics help you identify top-performing and most viewed ASINs to optimize your Store layout, gain insights on which products have the highest engagement (view-based CTR) and sales (click-based CVR) to identify strategies for your Store and ads campaigns, and identify consumer trends based on customer engagement.
In this tab, you’ll have access to:
- Product Engagement Totals: Provides the Store totals for ASIN views, clicks, and click-through rate (total views divided by total clicks).
- Top-clicked Product: Shows the top-clicked product of all ASINs listed on the Store. It also shows views, clicks, click-through rate, purchases, conversion ratio, and average sales prices.
- Product Engagement: A table to view detailed ASIN engagement metrics for each ASIN listed on the store.
- For each ASIN, the table shows renders, views, in-stock views, in-stock view rate, in-stock view average price, clicks, click-through rate, add-to-cart, purchases, units sold, conversion ratio, and average sales price.
Sales Tab
There are 5 dashboards related to sales:
- Sales: This chart shows your sales over the selected date range, and can help you understand if your Store and campaigns are helping to drive sales.
- Units sold: This chart shows you how many ASINs you’ve sold, expressing sales by unit.
- Top sources by sales: This chart shows sales based on where shoppers accessed your Store, helping you determine if certain sources are more lucrative than others.
- Top pages by units: This chart shows which pages help drive unit sales, helping you assess the best pages for encouraging shoppers to browse your PDPs.
- Daily Breakdown: This section showcases a summary of the above charts, organized by date.
- Analyze performance day by day, sorting which days had the highest or lowest daily visitors, views, views per visitor, units sold, and total sales.
Pages
This tab provides a high-level overview of individual page performance across your Brand Store. Sort your pages by various metrics to glean targeted insights on catalog performance or discover potential areas for improvement to your eCommerce strategy.
Sources
Explore how consumers found your products/brands using this tab. Filterable by metrics, discover whether shoppers found your brand through Amazon Organic Traffic, Amazon Sponsored Brands, and Other Sources.
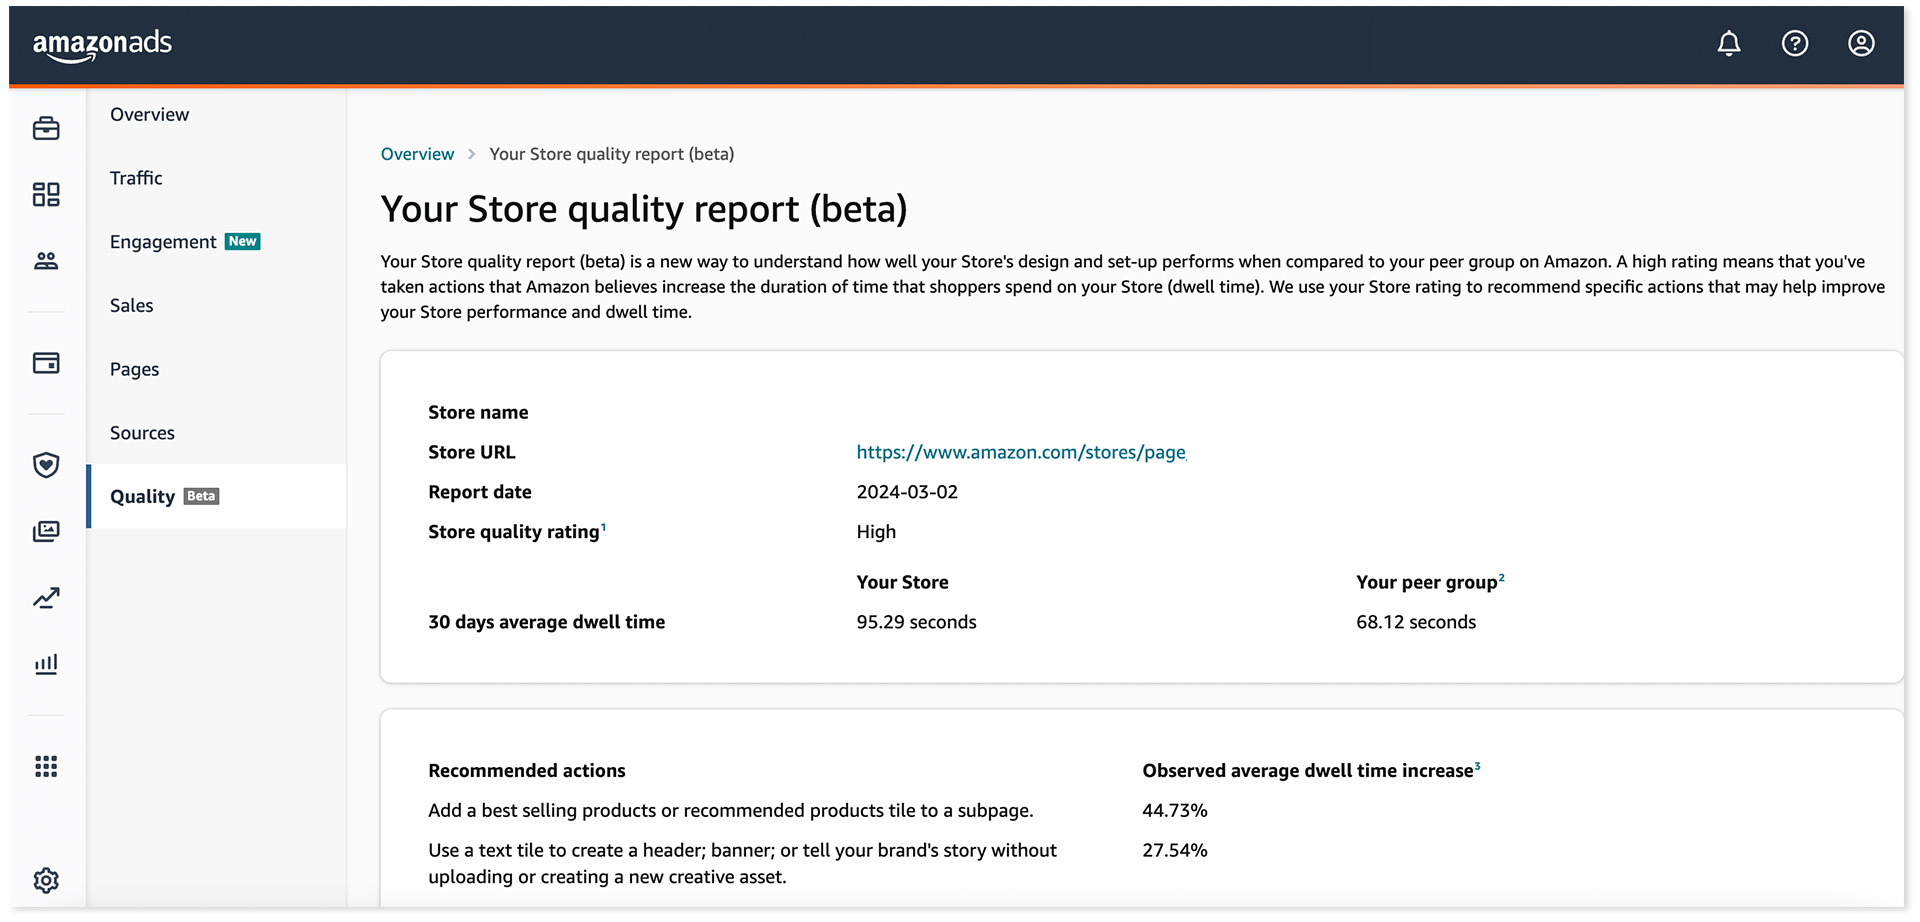
Quality Report
Currently in Beta for some brands, the Quality Report offers a new way to compare your store with your peer brands. Brand Stores with higher ratings have been judged by Amazon to be optimized to maximize consumer Dwell Time.
Amazon adds both the specific steps that brands should take, as well as steps that have already been taken. Entrepreneurial brands should use their score to take actionable steps to improve their Brand Store.
Macarta is Here to Help
We’ve helped large and small brands achieve major successes throughout these last few difficult years, and we look forward to continuing that success in the future. From Brand Store optimization to advanced solutions using DSP, we’ve been pushing retail media advertising to its limits to meet eCommerce trends and ensure major successes for our Brand Partners.
From our Denver-based headquarters, and with offices worldwide, Macarta is a global full-service marketplace agency specializing in retail media to drive growth and sustained success for our brand partners. Reach out to us here, and let’s get started!